For instance, when I started with Personal Kanban and reviewed my processed tasks of the past month for the first time, I noticed that I had spent considerably more time on one kind of task than my gut feeling told me. I explained this as a one-off, surely the data couldn't be right. The next month, the data showed the same and so did the month after that.
I had to admit that my gut feeling was simply wrong and unconsciously I had lied to myself about it all the time. So, I sat down and asked myself how it could be and what I could do about it until I understood that a big portion of the time was lost because of procrastination. Wasted time that I didn't keep track of in my mind ("but it only takes me 30 minutes to do that!") but that was clearly made visible by my Personal Kanban (well, it did take me a total of 2 hours on average until I was done with it, the truth can be shocking).
Metrics
There are a variety of metrics and charts that one can use, for example the Cumulative Flow Diagram (CFD). What many of these metrics have in common though is that they require some counting of items. Counting a large number of post-its can be a tedious task if you want to create a new type of chart and need the raw data, so here's a shortcut that might save both time and nerves.
Let's assume that I want to create a pie chart showing the distribution of items per category. Each category has a different post-it colour, so distinguishing them is simple. Luckily, they are already presorted, but even the smallest stack of post-it notes looks like it's over a hundred - with some others being a multitude of that. Combined, there must be way over a thousand post-its, the result of over a year of using Personal Kanban. Counting them note by note definitely doesn't sound like fun - and the chance of messing it up is not small either.
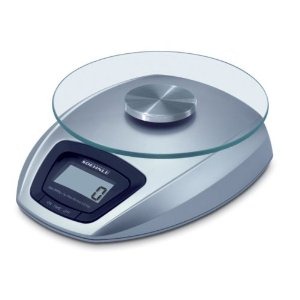
The good thing is that post-its are standardized, they have the same measurements, the same thickness, and most importantly: they have the same weight. A pack of 450 notes weighs about 190 grams (depends on the brand of notes, so don't use that number blindly), so with the help of your kitchen scales and some basic mathematics it's an easy thing to calculate the amount of items per stack.
Here's what the weighing tells us:
| Category | Weight |
|---|---|
| Household Chores | 185g |
| Shopping | 138g |
| Socialising | 69g |
| Office | 121g |
| Learning | 148g |
If 450 notes are 190 grams, it means that calculating 450 / 190 * 185 yields the number of items in the Household Chores stack - 438. For a pie chart I wouldn't even need the totals, but for completion's sake, there we go:
| Category | Amount |
|---|---|
| Household Chores | 438 |
| Shopping | 327 |
| Socialising | 163 |
| Office | 287 |
| Learning | 351 |
Sometimes, the result will be off by an item (if you are curious enough to check) but for a chart, the result is good enough.
